Category: News and Events

News and Events

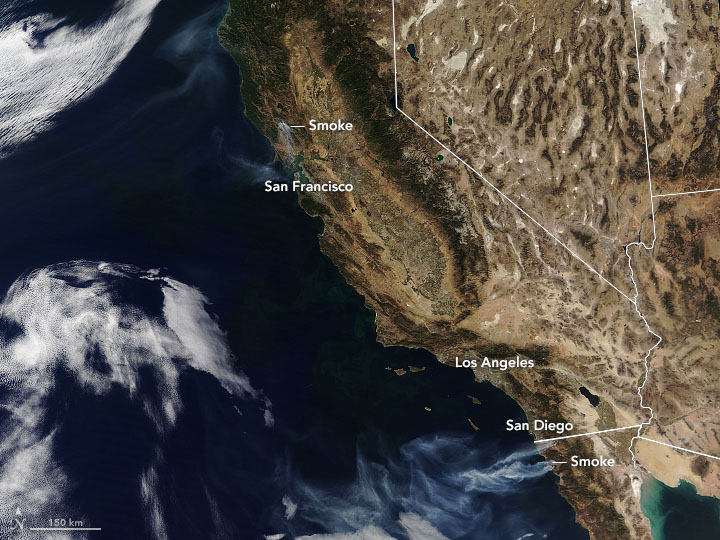
Hot, dry weather and fierce easterlies fanned the flames of several blazes, endangering homes and lives. On October 25, 2019, the Moderate Resolution Imaging Spectroradiometer (MODIS) on NASA’s Terra satellite acquired a natural-color image (top) with a wide view of fires near the Pacific Coast.

https://earthobservatory.nasa.gov/images/145787/winds-drive-smoky-wildfires-in-california-mexico

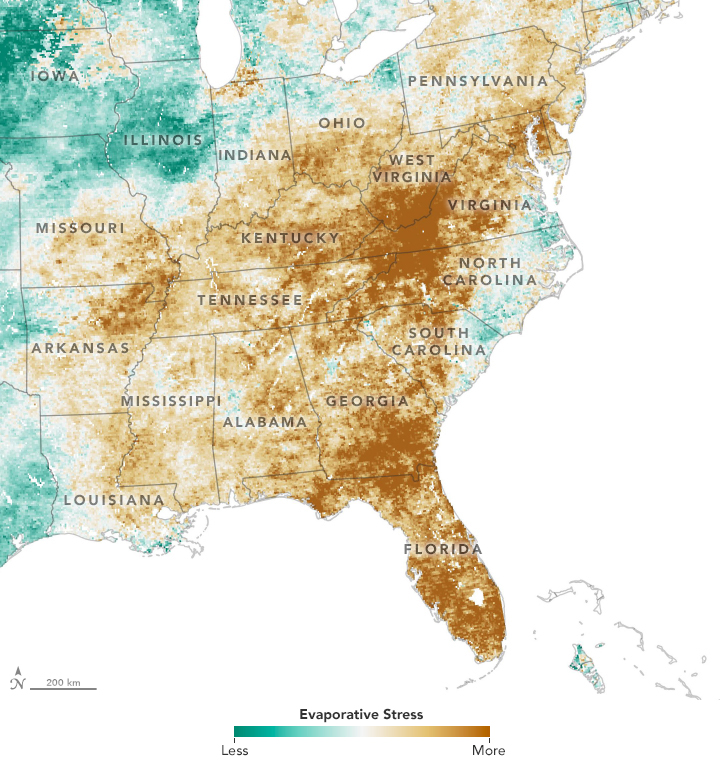
After a wet spring in the eastern United States, a quick-onset drought has parched fields. The maps show Evaporative Stress Index (ESI) data, a drought indicator based on observations of land surface temperatures from National Oceanic and Atmospheric Administration geostationary satellites and on observations of leaf area index from NASA’s Terra and Aqua satellites and the Visible Infrared Imaging Radiometer Suite (VIIRS) on Suomi NPP. The combination makes it possible to gauge evapotranspiration—how much water is evaporating from the land surface and from the leaves of plants.

https://earthobservatory.nasa.gov/images/145762/a-flash-drought-dries-the-southeast

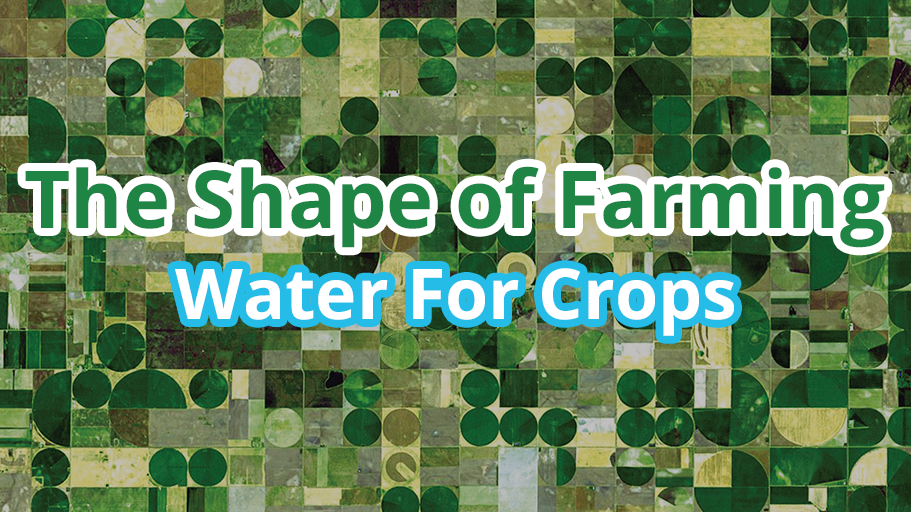
Farmers use a number of different methods to irrigate crops, and some of them result in pretty interesting shapes.  In this issue, The Shape of Farming; Water for Crops, EO Kids looks at what water has to do with different types of farming practices, and how these practices look from space. Plus, grow your own mini-farm and see how your garden grows with this month’s “Data Viz.”

https://earthobservatory.nasa.gov/blogs/eokids/the-shape-of-farming-water-for-crops/

Do you like clouds? Like to help scientists look at MODIS data a little differently…from below?  Then join citizen scientists around the globe in the Fall Cloud Challenge. Download the GLOBE Observer app, after registering, tap the clouds protocol icon, and then follow the prompts within the app. Before you know it, you’ll be a cloud expert and be providing valuable data from the ground about what’s up in your sky. The Fall Cloud Challenge runs October 15 – November 15, 2019.

https://earthobservatory.nasa.gov/blogs/earthmatters/2019/10/04/nasa-globe-fall-data-challenge-whats-up-in-your-sky/

Interested in joining the 2019 NASA Space Apps Challenge? Are you interested in helping better understand how to track air quality around the world using NASA data?

You can. Space Apps is an international hackathon for coders, scientists, designers, storytellers, makers, builders, technologists, and others in cities around the world, where teams engage with NASA’s free and open data to address real-world problems on Earth and in space. Space Apps will take place on October 18‑20,2019.

Terra is supplying useful data from MISR and MODIS for one challenge: The Surface-to-Air Quality Mission. The challenge is to integrate NASA data, ground-based air quality data, and citizen science data to create an air quality surface that displays the most accurate data for a location and time. Create algorithms that select or weight the best data from several sources for a specific time and location, and display that information.

Air pollution is associated with almost 5 million annual deaths worldwide as and costs the global economy $225 billion in lost labor income and $5 trillion in welfare losses annually. However, in most of the world, reliable, real-time air quality data are not available. This leaves people lacking understanding of the air they breathe, that could potentially have harmful effects.

Read more about the background of the challenge, potential considerations, and explore resources, including Terra data, and help solve a real-world problem using real NASA data. Sign up and good luck!

Registration link: https://2019.spaceappschallenge.org/auth/signup/