With Amazon wildfires in the news, a study published in the journal of Ecohydrology uses ASTER data and data from the Large Scale Biosphere Atmosphere Experiment in Amazonia (LBA) to look at how changes to land cover in the Amazon affect the exchange of water and heat between the land surface and the atmosphere.
Gabriel Oliveira, Nathaniel A. Brunsell, Elisabete C. Moraes, Yosio E. Shimabukuro, Thiago V. Santos, Celso Randow, Renata G. Aguiar, Luiz E.O.C. Aragao. Effects of land‐cover changes on the partitioning of surface energy and water fluxes in Amazonia using high‐resolution satellite imagery. Ecohydrology, 2019; DOI: 10.1002/eco.2126
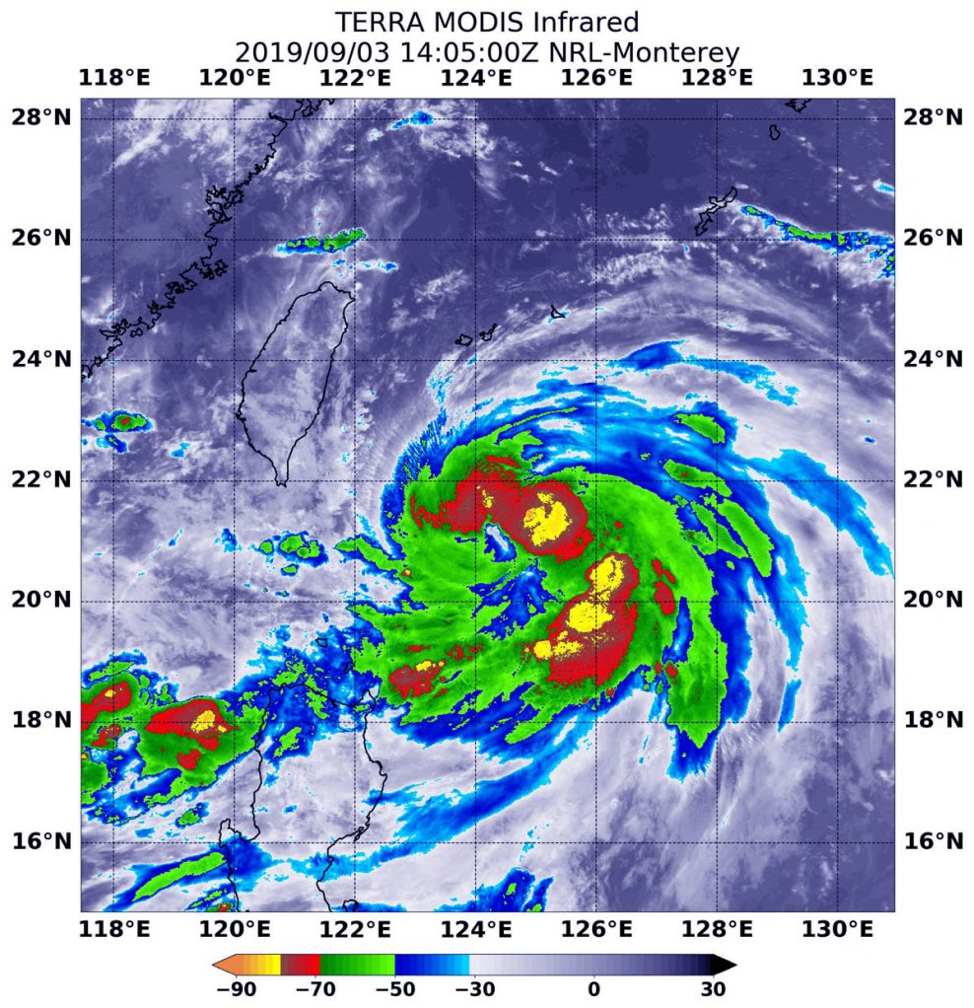
Sep. 03, 2019 – NASA Infrared Eye Analyzes Typhoon Lingling
The storm that became
Typhoon Lingling strengthened very quickly in the Northwestern Pacific Ocean
and infrared imagery from NASA revealed the powerful thunderstorms fueling that
intensification.
On
Sept. 3 at 12:05 p.m. EDT (1405 UTC) the MODIS instrument that flies aboard
NASA’s Terra satellite showed areas northeast and southeast of Typhoon
Lingling’s center where cloud top temperatures were as cold as minus 80 degrees
Fahrenheit (minus 62.2 Celsius). Credit: NASA/NRL
Lingling formed on Sept.
2 as Tropical Depression 15W and strengthened quickly into a tropical storm and
then a typhoon. Although Lingling is to the northeast of Luzon, northern
Philippines, there are still some warning signals in effect on Sept. 3.
Tropical cyclone wind signal #1 is in effect over the Luzon province of
Batanes.
On Sept. 3 at 12:05 p.m.
EDT (1405 UTC), the Moderate Imaging Spectroradiometer or MODIS instrument that
flies aboard NASA’s Terra satellite used infrared light to analyze the strength
of storms within the typhoon. NASA researches these storms to determine how
they rapidly intensify, develop and behave.
Tropical cyclones are
made of up hundreds of thunderstorms, and infrared data can show where the
strongest storms are located. They can do that because infrared data provides
temperature information, and the strongest thunderstorms that reach highest
into the atmosphere have the coldest cloud top temperatures.
MODIS found those
strongest storms were northeast and southeast of the center of circulation
where cloud top temperatures were as cold as minus 80 degrees Fahrenheit (minus
62.2 Celsius). NASA research has found that cloud top temperatures that cold
indicate strong storms with the potential to generate heavy rainfall.
At 11 a.m. EDT (1500
UTC), the Joint Typhoon Warning Center or JTWC said that Typhoon Lingling,
known locally in the Philippines as Liwayway was located near 21.4 degrees
north latitude and 124.2 degrees east longitude. That is 364 nautical miles
southwest of Kadena Air Base, Okinawa, Japan. Lingling was moving to the north
and had maximum sustained winds near 65 knots (75 mph/120.3 kph).
JTWC forecasters said
that Lingling is moving north and is expected to intensify to 100 knots (115
mph/185 kph) upon passing east of Taiwan. The system will then weaken on
approach to the Korean peninsula, but still be at typhoon strength.
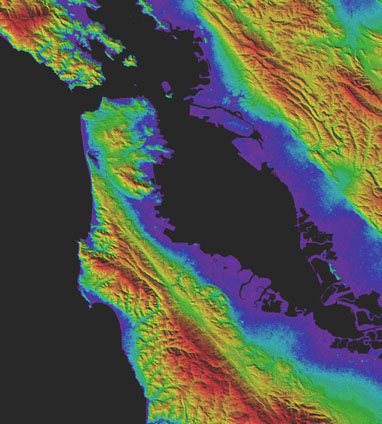
How tall is Mount
Everest? How low is Death Valley? How high are the hills behind your home? What
about the elevation of your favorite lake or river? Between the most northern islands
of Greenland and the interior of Antarctica, elevation data from the Advanced
Spaceborne Thermal Emission and Reflection Radiometer (ASTER) Global Digital
Elevation Model (GDEM) Version 3 can be
accessed for free. The data is downloadable from Japan Space Systems and
from NASA’s Land Processes Distributed Active Archive Center (LP DAAC).
The GDEM covers more
land area at a higher resolution, while also decreasing water area anomalies.
This is due in large part to the development of an additional new product, the
ASTER Water Body Dataset (ASTWBD), which identifies all water bodies as either
ocean, river, or lake. This is the first product providing a water mask that
covers nearly the entire surface of Earth.
The data are available with transformation services via the
Application for Extracting and Exploring Analysis Ready Samples (AρρEEARS) at https://lpdaacsvc.cr.usgs.gov/appeears/.
Over the last two decades, the Earth has seen an increase in foliage around the planet, measured in average leaf area per year on plants and trees. Data from NASA satellites shows that China and India are leading the increase in greening on land. The effect stems mainly from ambitious tree planting programs in China and intensive agriculture in both countries.Credits: NASA Earth Observatory
The world is literally a greener place than it was 20 years ago, and data from NASA satellites has revealed a counterintuitive source for much of this new foliage: China and India. A new study shows that the two emerging countries with the world’s biggest populations are leading the increase in greening on land. The effect stems mainly from ambitious tree planting programs in China and intensive agriculture in both countries.The greening phenomenon was first detected using satellite data in the mid-1990s by Ranga Myneni of Boston University and colleagues, but they did not know whether human activity was one of its chief, direct causes. This new insight was made possible by a nearly 20-year-long data record from a NASA instrument orbiting the Earth on two satellites. It’s called the Moderate Resolution Imaging Spectroradiometer, or MODIS, and its high-resolution data provides very accurate information, helping researchers work out details of what’s happening with Earth’s vegetation, down to the level of 500 meters, or about 1,600 feet, on the ground.
The world is a greener place than it was 20 years ago, as shown on this map, where areas with the greatest increase in foliage are indicated in dark green. Data from a NASA instrument orbiting Earth aboard two satellites show that human activity in China and India dominate this greening of the planet.Credits: NASA Earth Observatory
Taken all together, the greening of the planet over the last two decades represents an increase in leaf area on plants and trees equivalent to the area covered by all the Amazon rainforests. There are now more than two million square miles of extra green leaf area per year, compared to the early 2000s – a 5% increase.
“China and India account for one-third of the greening, but contain only 9% of the planet’s land area covered in vegetation – a surprising finding, considering the general notion of land degradation in populous countries from overexploitation,” said Chi Chen of the Department of Earth and Environment at Boston University, in Massachusetts, and lead author of the study.
An advantage of the MODIS satellite sensor is the intensive coverage it provides, both in space and time: MODIS has captured as many as four shots of every place on Earth, every day for the last 20 years.
“This long-term data lets us dig deeper,” said Rama Nemani, a research scientist at NASA’s Ames Research Center, in California’s Silicon Valley, and a co-author of the new work. “When the greening of the Earth was first observed, we thought it was due to a warmer, wetter climate and fertilization from the added carbon dioxide in the atmosphere, leading to more leaf growth in northern forests, for instance. Now, with the MODIS data that lets us understand the phenomenon at really small scales, we see that humans are also contributing.”
China’s outsized contribution to the global greening trend comes in large part (42%) from programs to conserve and expand forests. These were developed in an effort to reduce the effects of soil erosion, air pollution and climate change. Another 32% there – and 82% of the greening seen in India – comes from intensive cultivation of food crops.
Land area used to grow crops is comparable in China and India – more than 770,000 square miles – and has not changed much since the early 2000s. Yet these regions have greatly increased both their annual total green leaf area and their food production. This was achieved through multiple cropping practices, where a field is replanted to produce another harvest several times a year. Production of grains, vegetables, fruits and more have increased by about 35-40% since 2000 to feed their large populations.
How the greening trend may change in the future depends on numerous factors, both on a global scale and the local human level. For example, increased food production in India is facilitated by groundwater irrigation. If the groundwater is depleted, this trend may change.
“But, now that we know direct human influence is a key driver of the greening Earth, we need to factor this into our climate models,” Nemani said. “This will help scientists make better predictions about the behavior of different Earth systems, which will help countries make better decisions about how and when to take action.”
The researchers point out that the gain in greenness seen around the world and dominated by India and China does not offset the damage from loss of natural vegetation in tropical regions, such as Brazil and Indonesia. The consequences for sustainability and biodiversity in those ecosystems remain.
Overall, Nemani sees a positive message in the new findings. “Once people realize there’s a problem, they tend to fix it,” he said. “In the 70s and 80s in India and China, the situation around vegetation loss wasn’t good; in the 90s, people realized it; and today things have improved. Humans are incredibly resilient. That’s what we see in the satellite data.”
This research was published online, Feb. 11, 2019, in the journal Nature Sustainability.
Credits: NASA Earth Observatory
For news media:
Members of the news media interested in covering this topic should get in touch with the science representative on the NASA Ames media contacts page.
Author: Abby Tabor, NASA’s Ames Research Center, Silicon Valley