

May 22, 2009
Spring and early summer are typically rainy in the Midwestern United States. These warm rains that help the early season crops get started, are vital to agriculture, but in the spring of 2009 the rains were well beyond the normal amount. From Wisconsin to Kansas and across to Indiana, deluge after deluge pounded the region. All through the spring season, extreme rain events stacked up like airplanes at a busy airport and this week brought yet another cycle of heavy rains to the already waterlogged farmlands of Central Indiana. This rain pattern, driven by an area of low pressure over the Central Plains combined with high pressure anchored off the Southeast coast of the U.S. to channel moisture up from the Gulf of Mexico into the mid-section of the country.
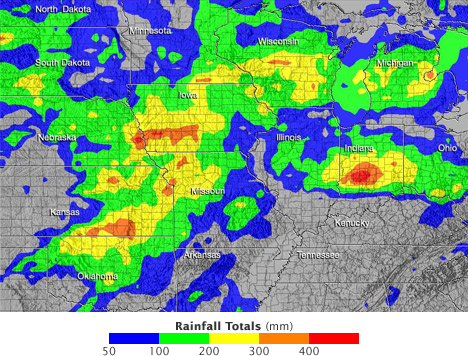
Map of rainfall in the American midwest from June 2-12, 2008. (NASA image courtesy Tropical Rainfall Measuring Mission.)
On the night of June 6, 2008, an intense rainstorm arrived and continued until the early hours of June 7. In the course of one night, Central Indiana received nearly 11 inches (280 mm) of rain, resulting in widespread flooding throughout the region. Many areas were evacuated. On June 8, the Wabash Valley between Lafayette and Terre Haute, Indiana, was placed under flood alert; all residents near the Wabash River were urged to evacuate their homes. On June 9th, President George W. Bush declared 29 counties in central Indiana a major disaster area. In all, the extreme rain event lasted approximately 10 days, caused numerous fatalities and caused $126 million in damages.
Additional articles and images from this time are available on the Earth Observatory.
As a result of better forecasting and flood prediction, the damage and human suffering caused by such floods is now less than it would have been as little as 50 years ago. The advent of modern weather radar and satellite monitoring of precipitation, combined with sophisticated modeling of river flooding patterns, has allowed local officials to be able to prevent large losses of life and property. However, even more accurate predictions are possible as the science and understanding of precipitation patterns continues to improve. Through their contributions of rain gauge data, citizen scientists can play a role in increasing the understanding of precipitation patterns.
The Science
Earth has often been called the “just right” planet. What makes Earth “just right” for life?-our weather and climate. Our unique weather and climate, in other words, temperature combined with the quantity of rainfall and other precipitation, determines where life will flourish or perish on Earth. Too much rainfall, and rivers flood, too little, and soils dry out, making it difficult for plants and animals to survive, resulting in drought and famine.
Water is essential to all life. It comprises 75% of our bodies. We get water from drinking water and from the foods we eat. Water is used for everything. Not only do we use water to grow our crops, it is essential in the manufacturing and transport of our goods and in the processing of our waste. And yet very little fresh water is available for our use. Most of Earth’s water is either too salty (the ocean) or frozen in glaciers.
Additionally, water and precipitation are critical in the redistribution of heat energy around the globe. This movement of water around the Earth is what is known as the water, or hydrological, cycle. Some of the Sun’s energy that reaches the Earth’s surface is used to evaporate and transport the water vapor from one place to another around the Earth. As this water vapor cools it condenses, forming clouds and precipitation.
Throughout history, humans have strived to understand and even control these patterns of weather and climate. By developing an understanding of the patterns of precipitation, scientists are making possible increasingly accurate weather, flood and drought forecasts. In the case of drought, these forecasts allow water managers to decide how to allocate precious water resources. Conversely, in the case of flood events, careful precipitation monitoring and forecasting can improve strategies intended to prevent damage and suffering.
Monitoring Precipitation: How Citizen Scientists Can Help
Scientists use computer models to learn about precipitation patterns and the conditions, both on the land and in the atmosphere, that control them. Models not only allow forecasters to tell you how much rain to expect in tomorrow’s storm, but they also allow scientists to understand how precipitation changes over time.
To check on the models’ accuracy, scientists compare model results to rainfall measurements from ground-based weather stations and satellite measurements. The measurements reveal large- and moderate-scale precipitation patterns such as the anomalies that occur during El Nino and La Nina, when changes in ocean temperatures cause droughts and floods throughout the world.
Models, combined with satellite and ground measurements, have revealed interesting new understandings of precipitation patterns. For example, more rain falls downwind of large cities, and the timing of rainfall can be influenced by weekly commuter cycles. (See Urban Rain, a feature article on the Earth Observatory)
The more information scientists have to both observe patterns and refine the models, the better they understand the processes that control rain. Ground-based measurements provide the most accurate record of rainfall, but ground stations only record rain at a single location, leaving a gap between stations. Since rainfall totals can vary within a small area, these data gaps make it difficult for scientists to learn about the mechanisms that cause small-scale variations in rainfall.
Satellites, on the other hand, provide a “snapshot” of rainfall over a wide area at a given point in time. Satellites don’t have the spatial data gaps that ground stations have, but they do have a time gap-they only see rainfall when they fly over it. Because satellites pass a region only once every 15-30 minutes, precipitation that is light or short-lived is hard to catch accurately. In fact the best rain measuring satellite, which uses radar, passes over every 2-4 hours.
Satellites also have limitations in their monitoring ability over certain geophysical regions. Over land, errors in estimates are generally higher near coastal areas and in regions covered in snow and ice. Precipitation that occurs in relatively shallow clouds, such as ones that occur due to wind flow over hills, valleys and mountains are also likely to have more errors in estimation.
Finally, satellites record the average rainfall in a very wide area-at best, four kilometers across. This means that the satellites can easily miss small patterns such as the influence of local topography (cities, land cover, etc.) on rain.
To compensate for weaknesses in both types of observations, scientists match ground measurements to satellite data and use the relationship between the two to reveal patterns. A large network of ground measurements, such as those collected by citizen scientists, will increase scientists’ ability to understand patterns of rainfall and changes in rainfall.
- Why Citizen Science for Precipitation?
- Step by Step: Backyard Observation
- Earth Observation With Satellites
- Tools and Data Quick Reference
- Additional Resources