

How successfully do rain gauges catch rainfall patterns? Do the satellites record the same patterns of data as the ground-based gauges? How many gauges are required in order to observe regional patterns in rainfall? Scientists compare measurements from rain gauges with satellite measurements to answer these and other related questions. By increasing the number of rain gauge measurements, citizen scientists can help increase the overall accuracy and precision of space-based precipitation monitoring. Using the June 2008 Midwest flood event, this section illustrates how to explore satellite data and rain gauge data together to answer questions about regional rainfall.
For this example, we are going to use a station in Monroe County, in south-central Indiana. The station, near Indianapolis, Indiana, received a record-breaking period of rainfall from June 2-12, 2008. This extreme rainfall event subsequently caused intense flooding in the Ohio and Lower Mississippi watersheds.
Part 1. Observer (Ground-based) Data
How to find a station of interest in CoCoRaHS.
Step 1. Access the map of the area that you are interested in.
- Launch the CoCoRaHS website
- Once the site has loaded, click on the word, “maps”.

- Once the daily maps page loads, select the “Station Number Maps” link from the list of map types. (last one in the list)
- Under map location title, use the pull down menu to select “stations,” choose your state of interest. In this case, choose Indiana.
- Next choose the “county,” Monroe. Leave the dates and map colors in their default settings.
- Click the button, “Get Map”.

- A map window will open with stations shown as little dots with their ID numbers next to them. We will use this station location map for reference later, so save it in the background or on your desktop.
Step 2. Acquire Precipitation data from CoCoRaHS
- Open a new window in your browser with the CoCoRaHS home page again.
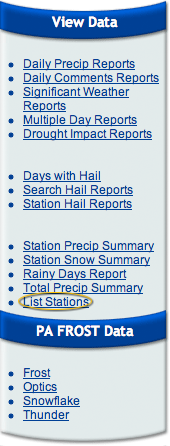
- This time on the top tab bar, click on, “view data”.
- A new page will load. On this page there will be a list of station types. Scroll most of the way down the list to the link “List Stations”. This is a list of stations by state and county. Click on this link.
- On the next page, choose the state and county you are interested in. For this example choose, Indiana and Monroe County. click search. There are many stations in Indiana, this will select only the 15 stations that are in Monroe County. The stations are listed by; state, county and ID number. In the table of stations, under the “view” heading, click on the magnifying glass in the row with “IN-MN-14″ to learn more about this station’s detailed location, including its latitude and longitude.
- Record this station’s latitude and longitude to use later in the comparison with satellite data. (Record the following: Station IN-MN-14, Latitude 39.265964, Longitude -86.521293.) Optional: click view the station in Google Maps.
- On the side bar, under the heading View Data, click on the link “station precip summary.” To access the data from this site.
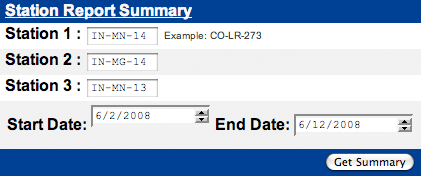
- In the next page that loads, you can type in the station ID numbers of any three stations that are of interest. Use the saved map of stations from step 3 of part 1 to view the station locations.
- Type in IN-MN-14, IN-MG-14, and IN-MN-3. Choose the dates 6-02-2008 and 6-12-2008 as your beginning and end dates. Click the “get summary” button.
- You will get a table of data. Check the data to see that it makes sense-is it what you asked for?
- Look for any days of intense precipitation. In this case, there was a rainy period from approximately June 1 -15, 2008. What date did the rainfall amount peak? How do the stations vary?
- Once you have checked the data, copy and paste the station’s data from the CoCoRaHS site into a spreadsheet program such as excel.
- Since satellites report rain rate in millimeters per hour it will be easier to compare results if you use excel to convert the data from inches to millimeters by multiplying the total by 25.4. (1 inch=25.4 mm)
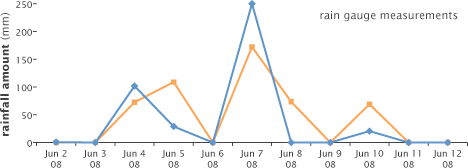
- Produce a graph of rainfall rate in millimeters per 24 hours (y axis) versus date (x axis). Save your graph for comparison with the graph of satellite data that you will produce in the part 2.
Part 2: Above and Below
Comparing CoCoRaHS data with NASA Satellite data from the same location and time period. This example uses the 3-hourly TRMM and Other Rainfall Estimate (3B42 V6).
The Tropical Rainfall Measuring Mission (TRMM, pronounced “trim”) satellite is the most accurate rainfall observing satellite to orbit the Earth. It carries a suite of five instruments that, when combined, allow scientists to gather a very detailed three-dimensional view of rainfall patterns. However, these instruments do not directly measure precipitation. Instead they use a combination of active radar and passive measurements to record the energy and water vapor flowing through the atmosphere. This data allows scientist to estimate precipitation patterns on large scales across the Earth. One instrument is “passive,” observing the intensity of radiant energy that the atmosphere, land, and ocean emit into space at microwave frequencies. The other instrument is the first weather radar in space, recording vertical profiles of rain, similar to surface-based radar systems.
Together, these data sets allow scientists to build a 3-D picture of rainfall patterns in space and time. These estimates are calibrated by comparing the results to ground based observations, such as rain gauges and radars, with the satellite data. By increasing the number of rain gauge measurements scientists will be able to increase the overall accuracy and precision of precipitation monitoring.
To complete the comparison of satellite and rain-gauge data, use the dates, and location of your the selected CoCoRaHS stations as a starting point for a comparison of satellite and observer data.
Step 1. Compare time series data from several rain gauges with that from the Satellites.
- Open a new window in your browser. Launch the Giovanni TRMM Online Visualization and Analysis System.
- When this page loads, you will see a map of the world. Use your cursor to draw a box around your area of interest, Indiana. Note what latitudes and longitudes are automatically input into the boxes below the map. Optional: Try drawing several boxes on the map in order to better understand the latitude and longitude numbers.
- Alternately, use the coordinates that you recorded in part 1 step 3, from the Monroe, Indiana CoCoRaHS observers site as a starting point.
- They were Station IN-MN-14 Latitude 39.265964, Longitude -86.521293
- In Giovanni choose coordinates that will give you a tight box around this area such as: -88 West, 42 North, 37.5 South , -84.5 East.
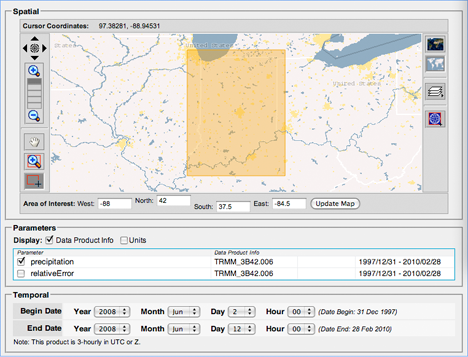
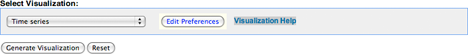
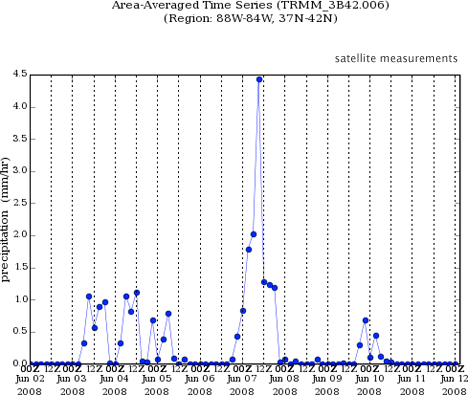
- Choose “precipitation” as the parameter, set the temporal dates to begin June 2, 2008, and end June 12, 2008, and the visualization as “time series”.
- Click the “generate visualization” button at the bottom of the page.
- A new page will appear, showing you the steps the program is executing to generate the results. After a few seconds, when the processing is complete, you will see a graph.
Note: the graph will show you rain rates as observed by the satellite. A rain rate is a measurement of how hard it was raining. By contrast, your gauge measures rainfall totals, the amount of rain that fell in a 24-hour period. In theory, the rain rate multiplied by 24 should match the 24-hour rainfall total. In practice, however, this is seldom true because rain does not fall at the same rate over 24 hours.
- Compare the graph of the satellite data to a graph of the CoCoRaHS data from Stations IN-MN-14 and IN-MG-14 during the same time period. Note that the gauges both recorded a large amount of rain on the same date that the satellites recorded a heavy rainfall rate.
Step 2. Mapping the Satellite Data.
While rate versus time is one way to analyze data for several gauges, a broader way to look at rainfall rates across a larger area is on a map. In this example you will plot rainfall rates for this time period on a map for the area. The resulting map will help you to understand where the rainfall was the greatest, allowing you to relate this information to other geographic information such as topographic features and urban areas. In this example, we are going use the rain gauge and TOVAS satellite data for the state of Indiana.
- Return to the Giovanni TRMM TOVAS site by clicking the back button from your results window.
- Use the same coordinates as in the previous example. Choose the time period June 2-12, 2008.
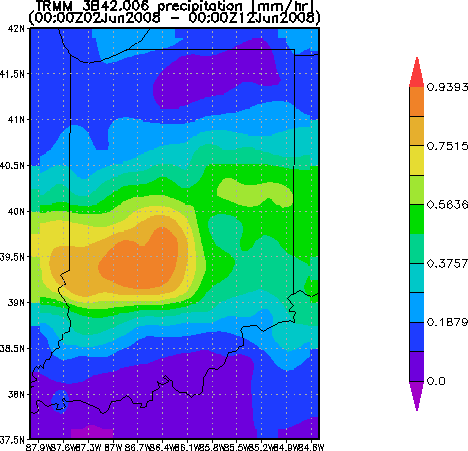
- This time change the parameter,setting to generate a map. Choose “Lat-Lon map, time-averaged” as your visualization.
- Click the “generate visualization” button.
- The computer will generate a map of the precipitation over the area and time that you have specified. This will appear as an image.
- You can also download this map to view in Google Earth.
- Click on the “download results” tab at the top of the page.
- Scroll down to the button of the page.
- Under the heading “Output Files”, click the radio button next to the KMZ icon to select this option.
- Then click the KMZ icon. It will download to your computer and, depending on your settings, launch Google Earth.
Once Google Earth has loaded, the file you will be able to see the precipitation pattern over the region that you selected.
In Google Earth, observe the map of rainfall intensity for the state of Indiana. In Google Earth, add other features such as rivers, roads and cities to your map.
In the summer of 2008 there were major floods in this region. Add the USGS EDNA watersheds layer.
Use the map to predict in which watersheds the floods would have occurred. How might you, as a local weather personality or hydrologist have advised the citizens living this region? Would you have encouraged citizens living downstream of Indianapolis to evacuate? Read more about this flooding event at an online news source such as MSNBC or CBS online.
You can broaden your understanding of the event using Giovanni to further analyze the satellite data.
Some other interesting visualizations that can be done in Giovanni:
- Choose “animation” to see the amount of rain each day for the period linked together in a quick time movie.
- Choose “Scatter plot” to plot rainfall data versus error to see the relationship between rainfall rate and error. The greater the rate the greater the error.
- Return to the TRMM site and choose the monthly averages. Choose the “anomaly plot” for the two-year period between January 2007 and December 2008. “Animate” the monthly averages.
Going Further
Other groups also collect precipitation data, which may be used in a comparison with satellite data. These groups include:
- Arizona: Rainlog
- Minnesota: MNgauge
- GLOBE
- NWS COOP network
If you are interested in studying rainfall patterns in Arizona, you can map gauge data from Rainlog and satellite data in Google Earth. Both Giovanni and Rainlog will allow you to download a Google Earth file. By layering the two files in Google Earth, you can compare rainfall patterns.
Related questions that could be addressed with satellite data:
- Compare precipitation to vegetation growth using the NASA Earth Observations web site.
- Compare precipitation to streamflow data, available from the United States Geological Survey and the National Weather Service. What does a 100-year flood mean for your watershed? The Floods section of the Earth Observatory contains satellite images of flooded rivers.
- Comparing precipitation and fire conditions as reported by the U.S. Forest Service’s Wildland Fire Assessment System.
- In Giovanni, analyze the seasonality of precipitation measurements with a Hovemoller plot or animation.
Precipitation
- Why Citizen Science?
- Step by Step: Backyard Observation
- Earth Observation With Satellites
- Tools and Data Quick Reference
- Additional Resources