

May 19, 2009
July 25, 2005, was a scorcher. From the Midwest to the Eastern Seaboard, people cranked up the air conditioner as temperatures soared over a hundred degrees in another of a line of hot days. Those brave enough to venture into the heat found the air thick with haze. The heat turned emissions from cars and power plants into a soupy haze of ground-level ozone and fine particles left over from burning fossil fuels. Trapped inplace by the high pressure system that had settled over the eastern and central United States, the haze had built up over several days. In many places, the Environmental Protection Agency warned that the air was unhealthy to breathe for those sensitive to poor air quality such as children, older adults, or people with heart disease, asthma, and other respiratory ailments.
But air quality was not the same everywhere. Pollution can build up in isolated pockets, and local sources (an industrial plant or a busy road) can add to the overall poor air quality. A network of citizen scientists monitoring air quality throughout a region could help reveal how pollution travels through the region and could help identify pollution “hot spots.”

The Moderate Resolution Imaging Spectroradiometer (MODIS) on NASA’s Terra satellite captured this photo-like image of haze in the Eastern United States on July 26, 2005. Easier to see over the ocean, gray-tan haze hangs over the Mid-Atlantic region. Fires are marked with red dots. The image illustrates that haze is not uniform. Image courtesy Earth Observatory.
Pollution and Health
Air is essential to life. Poor air quality threatens the health of all living things from humans to plants. There are many types of air pollution, and each have a different effect on human health. The two most common types of air pollution in the United States are ozone and particle pollution. Both irritate the respiratory system, making it difficult to breathe, but can also have a more serious impact on health.
Ozone is a colorless gas that forms when emissions from cars, power plants, and industry react with sunlight. Ozone is a major component in urban smog. Ozone pollution irritates the respiratory system, causing coughing and throat irritation, makes breathing difficult, aggravates asthma, and can inflame and damage the
lining of the lungs over time. See The Ozone We Breathe.
Particle Pollution is any kind of particle or liquid droplet in the atmosphere. Particle pollution, or aerosols, has many sources. Fine particles, small enough to get into the lungs, primarily come from combustion in cars, power plants, fires, and industry. Coarse particles tend to have natural sources such as dust or sea salt. Particle pollution may aggravate heart and lung disease. The number of hospital visits associated with lung and heart disease goes up when particle pollution is high. Particle pollution is associated with heart attacks and cardiac arrhythmias, causes difficulty breathing, and makes people more susceptible to respiratory infections.
Since air quality can have such a big impact on health, the U.S. Environmental Protection Agency issues color-coded air quality updates to alert people when pollution levels are high enough to be harmful. Many communities have established action plans to limit the impact of poor air quality on bad days.
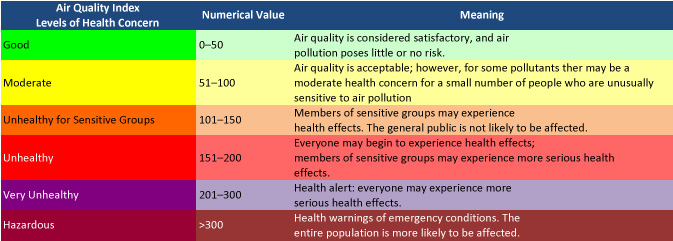
The EPA’s air quality index was designed to be an easy way to help people quickly relate current air quality to health risks. Table courtesy AirNow.
How is Air Pollution Monitored?
The EPA alerts are based on both forecasts made with models and current observations. More than 4,000 monitoring stations track six different types of air pollution, including ozone and particle pollution, across the United States. The stations record hourly data, as well as daily maximum and minimum measurements. To locate the station nearest you, see the EPA’s AirData web site.
These stations report what air pollutions levels were, but to provide warnings, the EPA has to make a forecast. Just as a weather forecaster uses a computer model to predict what the weather will be, forecasters at the EPA and state and local air quality offices use computer models to predict air quality. Models can show how pollutants will build in the atmosphere given the weather conditions and can predict where air pollution will travel. Models are necessary in predicting air quality because conditions change from day to day.
Air quality fluctuates from day to day for a number of reasons. Most obviously, air quality changes if more pollutants are put into the atmosphere. A large event such as a dust storm, wildfire, or volcanic eruption can dramatically darken the skies. Emissions also climb when energy demand goes up as it does on hot days. Scientists have also noted a weekly cycle in emissions dependent on local culture. In the United States, for example, air quality tends to be better on Saturdays and Sundays when fewer cars are on the road and electricity demand is lower because fewer businesses are operating.
Second, concentrations of pollutants in the atmosphere depend on the weather. Since sunlight is a necessary ingredient in ozone formation, ozone pollution levels tend to be highest during long summer days. A weather inversion, when warm air is trapped beneath a layer of cooler air, also leads to poor air quality since surface air has nowhere to go. Pollutants build in the pocket of trapped air. Inversions are especially common in cities surrounded by mountains such as Mexico City, Los Angeles, or Salt Lake City.
Finally, air pollution can have a local source, such as a power plant or factory, or it can come from somewhere else. Smoke from western wildfires can impact air quality in the Eastern United States. Dust from Africa clouds Florida’s skies, and haze from Asia can reach the U.S. West Coast. Satellites have been instrumental in tracking pollution as it travels from place to place around the globe.
Why Citizen Science?
Air pollution levels for your region are recorded at state monitoring stations, but air pollution does not necessarily spread itself evenly throughout the region. You may live next to a busy highway or some other source of pollution, or the topography of the land or city may concentrate pockets of polluted air near you. To know exactly what is in the air you are breathing, you need to monitor the air where you are.
A network of citizen scientists monitoring air quality will also provide valuable information to scientists who study air pollution and transport. Current measurements of air quality come from monitoring stations spread across the United States, but these provide isolated data points. It is difficult to draw conclusions about how air quality varies from place to place if you only have a few data points. Citizen scientists can contribute more information to fill in the gaps.
Currently, scientists get a broad picture of pollution in the atmosphere from satellites and models. The satellites provide global measurements of pollutants, but they don’t see in fine detail. A single satellite-based data point might give the average concentration of a pollutant in the atmosphere over a one square kilometer region. Further, the satellite sums up all of the pollution in a vertical slice of the atmosphere from Earth’s surface to the edge of space. Most can’t tell scientists what air pollution levels are near the surface of the Earth where people are breathing. Models are used to merge satellite measurements of the entire atmosphere with ground-based measurements. A network of citizen science measurements of air quality could help improve both the interpretation of satellite data and the accuracy of models.
Air Quality
- Why Monitor Air Quality?
- Observing Your Air Quality
- Satellite Observation
- Additional Information