Month: May 2016

McMurray 720_MODIS_06052016

fort_mcmurray_NRT+AOD_col_d[7]
NASA  Images from NASA Worldview (above) and created with data from MOPITT and MODIS (below) provided by the MOPITT Science Team. Caption by Sara Martinez-Alonso with Tassia Owen.

May 24, 2016
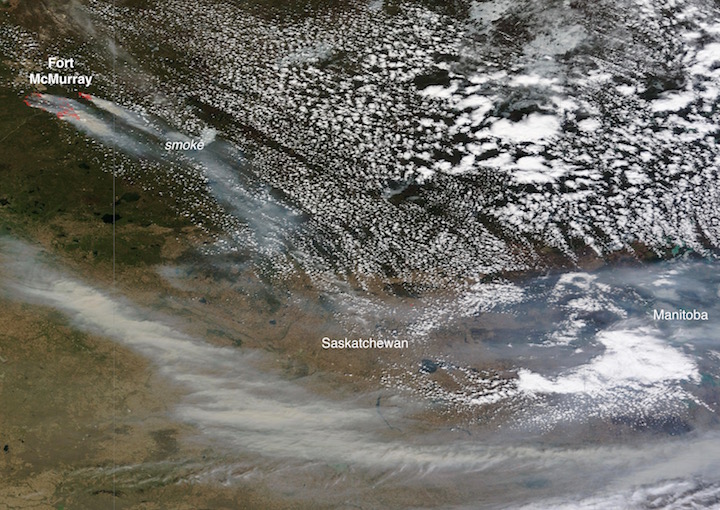
The Fort McMurray wildfire in Alberta, Canada not only had devastating impacts on its community, but the effect on air quality was also far reaching. Along with drifting smoke, wildfires cause increases in atmospheric carbon monoxide levels.

These maps were produced using data acquired by MOPITT and MODIS, two of the instruments on board NASA’s Terra satellite. These maps document the extent and composition of the Fort McMurray fire plume on May 6th and 7th.

MOPITT measures tropospheric carbon monoxide (CO). CO is mostly produced by incomplete fuel combustion, biomass burning, and oxidation of methane and other hydrocarbons. Shown here are MOPITT retrievals of CO total column generated in near real-time for use in the ECMWF MACC-III global data assimilation and forecasting system.

MODIS analyzes, among others, atmospheric aerosols, one of the greatest sources of uncertainty in climate modeling. The MODIS map shown here depicts aerosol optical depth (AOD), a measure of the extinction of solar light by atmospheric particles.

The similarity in the features shown in the two maps is quite obvious. The plume originates near Fort McMurray (shown with an asterisk) and extends mostly southeast for more than 1000 miles (1600 km), crossing state and country boundaries.

April 26, 2016

A Sudden Color Change on Lake KivuThe Moderate Imaging Spectroradiometer (MODIS) on NASA’s Terra Satellite captured images of a whiting event in Lake Kivu. The seasonal event is stronger this year, giving Lake Kivu a milky color. 


April 22, 2016

Using Clouds to Map Life – A team of researchers are using cloud data from the Moderate Imaging Spectroradiometer (MODIS) on NASA’s Terra Satellite to create detailed maps of cloud cover and variability. The team found that cloud cover could be an indicator and a better predictor of a songbird and flower’s range than temperature and precipitation.


April 17, 2016

Yellowstone National Park – Learn about Yellowstone National Park and view an image made possible by the Digital Elevation Model from the Advanced Spaceborne Thermal Emission and Reflection Radiometer (ASTER) on NASA’s Terra satellite.


April 14, 2016

Sierra Nevada Snowpack is Better, But not Normal – Snowpack in the Sierra Nevada mountains dwindled over recent years; however, the winter of 2015-2016 and the strong El Nino provided a thicker and more extensive snowpack. Regardless, snow levels in the Sierra Nevada mountains were still below average. Images from NASA’s Moderate Imaging Spectroradiometer (MODIS) clearly show the difference between years.


April 13, 2016

Antarctic Ice Shelf Sheds Bergs – The Moderate Imaging Spectroradiometer on NASA’s Terra Satellite captured this striking image of the formation of two new icebergs as they broke away from the Nansen Ice Shelf into the Southern Ocean on April 7, 2016.


April 9, 2016

Greening Ascension Island – When Charles Darwin first visited Ascension Island it was barren, but with the assistance of Joseph Hooker in the 1800s plants were introduced and now cover much of this once bleak island. The image from the Advanced Spaceborne Thermal Emissions and Reflection Radiometer (ASTER) on NASA’s Terra satellite shows the now green Ascension Island and it’s Green Mountain.


April 3, 2016

Pavlov Erupts Again – Pavlov Volcano, Alaska’s most active volcano, began erupting for the first time since November 2014. The Moderate Resolution Imaging Spectroradiometer (MODIS) instruments on NASA’s Terra and Aqua satellites acquired images of the ash plume at 11:45 a.m on March 28, 2016.